

Baseball statistics you should know for the upcoming season
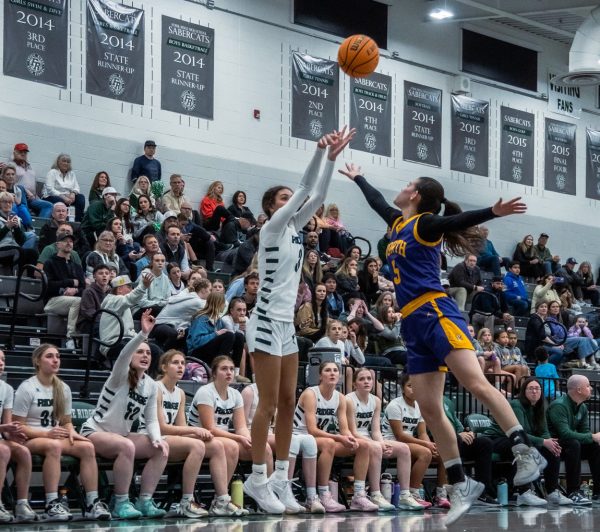
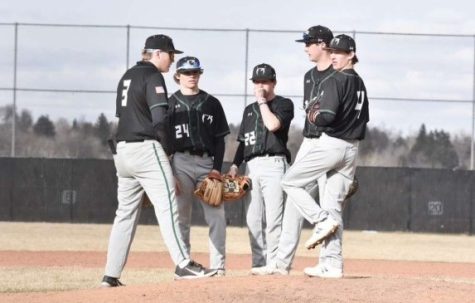
Spring, the transition period between winter and summer, happens to be home to one of my favorite sports: baseball. Since the Fossil Ridge High School baseball team’s first game is next week, I thought it might be a good idea to go over some of the most important baseball statistics. So, if someone during a game is talking about Earned Run Average (ERA) or batting average, you will know what they mean.
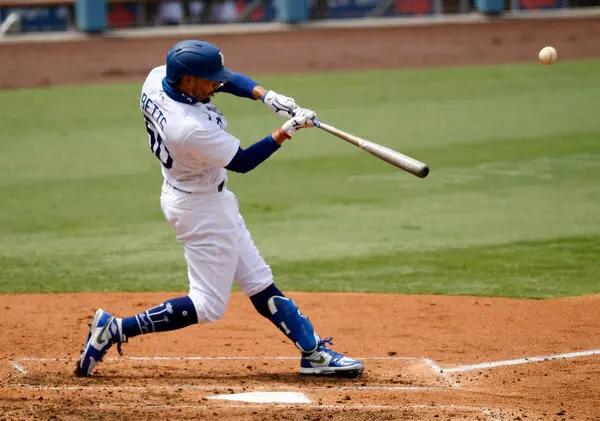
Starting off with the offensive statistics, there is batting average which is also known as AVG or BA. The bare-bones explanation is that it is the average amount of hits you have, divided by the number of at-bats that season. A decent batting average would be .250, a great batting average would be anything at .300 or higher. Four hundred is essentially the pinnacle of batting averages, and is a nearly unachievable goal in professional baseball.
Batting averages have steadily decreased over time for many reasons, but one of the most prevalent causes is that hitting home runs usually sells more tickets. In an article, according to the website baseball explains the current state of batting averages: “As hitters swing and miss more often, they also have learned that the optimal way to score runs is often to accept that strikeouts are part of today’s game, but when they do hit the ball, it’s best to hit it hard and high. So, home runs and strikeouts are up, and batting averages are way down.”
Moving on to the next offensive statistics, we have OBP or on-base percentage. On-base percentage, as suggested, is how many times the batter was on base from hits, walks, or hit by pitch (HBP), divided by the number of at-bats, walks, HBP, and sacrifice flies. OBP has changed the sport of baseball a lot because of a man named Billy Beane.
Beane, a General Manager for the Oakland A’s, came up with, what is now called, the Moneyball theory. This theory turned professional baseball on its head, as teams used to draft players with high BA due to their increased speed and strength when compared to their low-BA counterparts. Beane’s theory was that players with a higher on-base percentage would be more valuable than those with a lower on-base percentage even when those with the lower percentage as those with a low on-base percentage were not on base to score runs.
On to one of the most important defensive statistics, the before-mentioned, ERA. This statistic tells you the earned runs allowed by a pitcher per nine innings pitched. But what is an earned run?
An earned run is a run in which a hitter scores without the aid of an error. So, say you are up to bat, you hit a double to the right fielder, he fields the ball cleanly, and hits his cutoff. The person next in the lineup also hits a double and you are able to score; this is an example of an earned run. An unearned run would be if, during the second double, the outfielder did not field it cleanly and made an error and then you were able to score.
ERA is calculated by the number of innings pitched multiplied by nine. Historically, low ERA’s are better than high ones as you allow fewer runners on base and thus the other team was not able to score as many runs.
And there you have 3 of the 121 statistics of baseball. Of course, these 3 are very important in the game of baseball so they should give someone new to the game a pretty good chance of giving them a deeper understanding of baseball.
Your donation will support the student journalists of Fossil Ridge High School. Your contribution will allow us to purchase equipment and cover our annual website hosting costs.

Tim Cutler is a Senior this year at Fossil Ridge High School. He is joining the Etched in Stone team for the first time this year. Cutler’s Sophomore year, he took Journalism 1 and has since decided he was ready and excited to join the Journalism 2 family. As a new staff writer, Cutler is embracing...